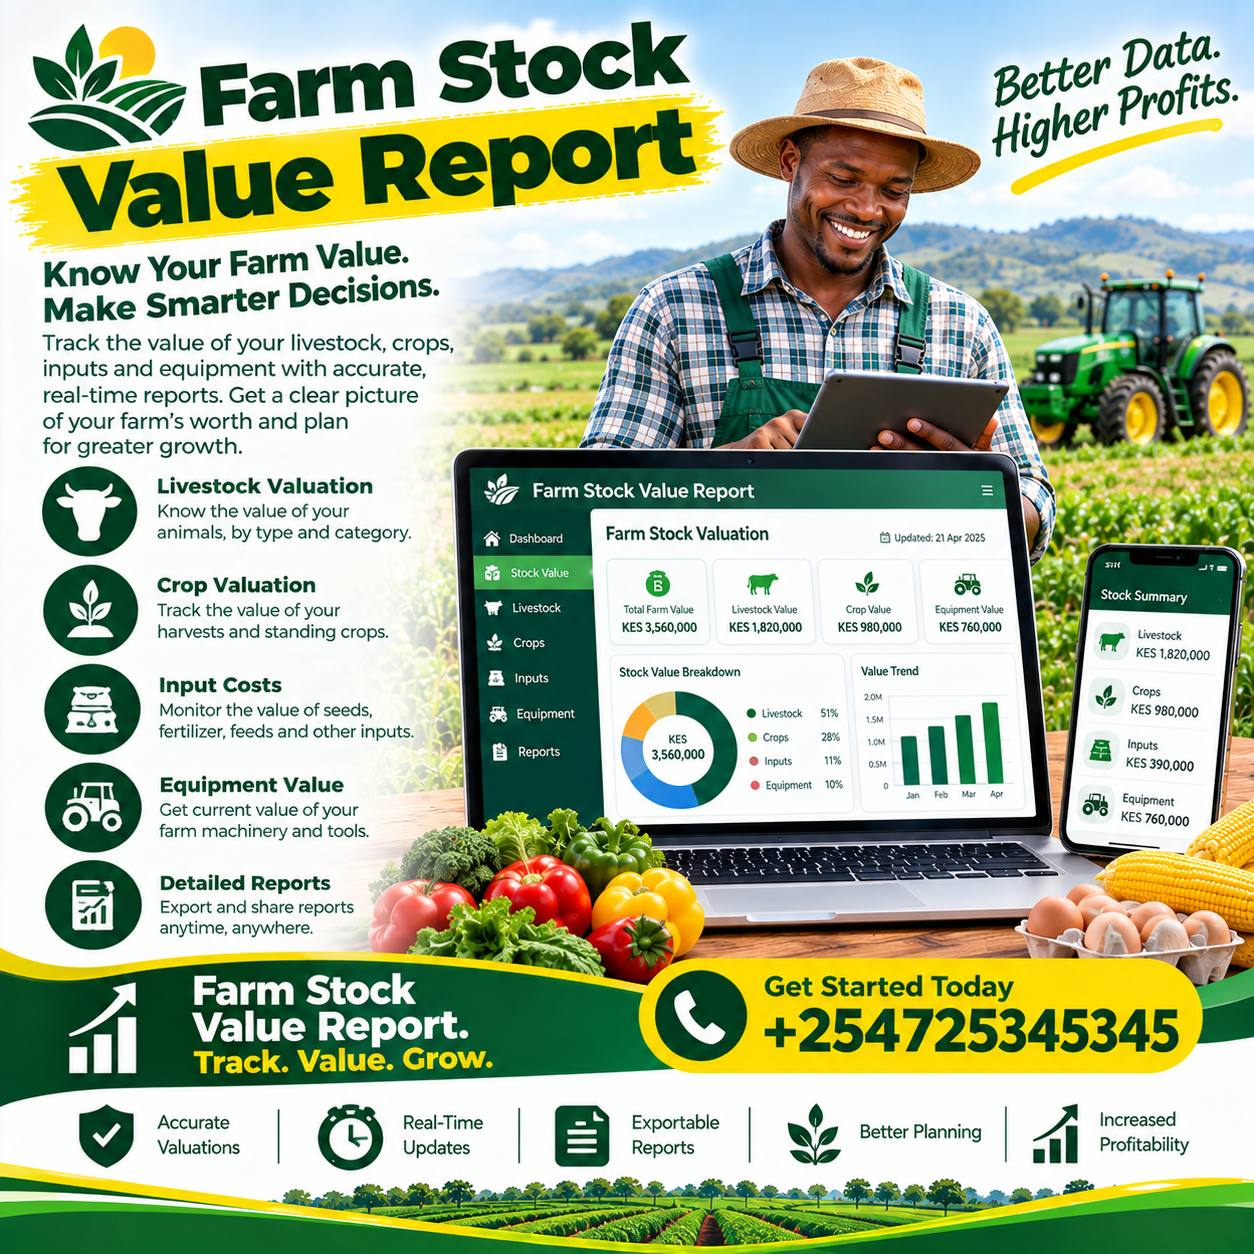
Farm stock value report is the financial document that answers a question most farmers have never been able to answer precisely: what is everything the farm physically holds actually worth — right now, this month, to the shilling? The store’s fertiliser, the godown’s feed, the barn’s hay, the herd in the paddocks, the flock in the houses, the graded eggs in the cold room, the maize in the hermetic bags — all of it is money in another form, and all of it usually goes unvalued.
Shops know their stock every evening because their stock sits on shelves with barcodes. Farms hold the harder version of the same problem: stock scattered across buildings, fields, and living animals that eat, grow, reproduce, and die daily. The result is that most farms never produce a valuation at all — or produce one annually, painfully, and never quite trust it.
A structured farm stock value report ends that uncertainty with a repeatable monthly workflow: quantities reconciled, values applied by stated policy, movements explained, and the whole assembled into one defensible figure that feeds the balance sheet, the loan application, and the management meeting.
The workflow matters more than the document. A report produced once a year is a photograph; a report produced monthly from disciplined records is a film — and the film is where losses get caught, capital gets released, and decisions get sharpened.
This guide walks through that workflow completely: why monthly valuation beats annual counting, the five steps from count to sign-off, how to value each stock category honestly, how to read the movement analysis, how the report feeds financing, and the systems that make the whole cycle run without heroic counting days.
What the Farm Stock Value Report Actually Is
At its core, a farm stock value report converts the farm’s physical holdings into financial figures: every category of stock quantified, every quantity valued by a stated method, every category totalled, and the total presented with its movement since the last period.
The report’s scope covers five categories. Inputs and consumables — seed, fertiliser, chemicals, medicines, fuel, packaging. Feed in all its forms. Livestock — every class of animal the farm holds.
Harvested produce awaiting sale. And durable inventory — tools, sprayers, fittings, and small equipment that behaves like stock because it moves, vanishes, and needs tracking. A complete farm stock value report includes all five; a partial one values only what was easy.
The report’s power comes from its pairing of two numbers per line: quantity and value. Quantity alone is a storekeeper’s count; value alone is a guess; and the pair together is a financial fact that can sit on a balance sheet and survive an auditor’s questions.
The movement column completes the design: each line showing its change since last month, in quantity and in value. A farm stock value report without movement is a photograph; with movement, it becomes the farm’s most diagnostic monthly document.
Why Monthly Beats Annual Valuation
The first reason is loss detection, and its mathematics are unforgiving. A leak that consumes five percent of store value monthly costs sixty percent across an annual cycle — and the annual valuation discovers all of it at once, unrecoverable. The monthly farm stock value report catches the same leak in its first month, at one-twelfth the damage.
The second reason is decision currency. Stock figures feed real decisions — buy or wait, sell or hold, feed the plan or adjust it — and decisions made on eleven-month-old figures are decisions made blind. Monthly valuation keeps the numbers inside the decision window.
The third reason is financing rhythm. Lenders and insurers ask for current asset evidence at unpredictable moments, and the farm whose farm stock value report is always one month old answers instantly — while the annual-valuing farm reconstructs under pressure every single time.
The fourth reason is habit economics. The monthly cycle turns valuation into routine: quantities reconciled from running records, spot-checks confirming them, and the full count reserved for quarterly verification. The annual approach forces a heroic count day whose cost and error rate both grow with the gap since the last one.
The fifth reason is the quiet compounding of reconciled records. Each month’s reconciliation keeps the tracked balances married to physical reality, so every subsequent month runs faster and cleaner — the exact opposite of the annual cycle, where each year’s count starts from the same fog. This compounding is what makes the monthly farm stock value report workflow self-improving.
The Five-Step Monthly Workflow
Step One: Reconcile Quantities Against Reality
The month’s cycle opens with quantity verification — and its depth depends on the category. High-value, high-risk items — chemicals, medicines, veterinary products — get a full physical count. High-turnover items — feed, fuel — get counted by exception: tracked balances spot-checked against the shelf.
Produce gets reconciled against its chain: harvest records in, sales out, storage losses accounted for. Livestock reconciles from its own event records — births, deaths, purchases, sales — verified by a physical count for any category whose events have drifted. The farm stock value report month begins with this truth-finding, because everything downstream inherits its accuracy.
The counting discipline stays constant: two people, one counting and one recording, discrepancies logged as found rather than smoothed. Every unexplained variance found in step one is a loss caught in week one — which is the entire financial point of the exercise.
Step Two: Apply Values by Stated Policy
Quantities become value through the farm’s stated valuation policy — and the policy must exist in writing before this step, because values applied by mood measure nothing. Inputs value at purchase cost on first-in-first-out, so older layers carry their original prices.
Feed values at cost, adjusted for any deterioration the count revealed. Produce values by state: near-term sale stock at expected sale value less remaining costs, long-hold stock at cost plus storage. Livestock values by the class policy — cost basis for breeding and growing stock, market basis for sale-ready animals. A farm stock value report that states its policy on its own face lets every reader know exactly which basis each line uses.
Step Three: Total and Assemble
Line values assemble into category totals, category totals into the report’s headline figure, and the headline carries alongside its previous-month comparison. The assembly is mechanical where the records are disciplined — minutes rather than evenings.
The assembled farm stock value report should fit on one page for management review, with detail attached behind it: the discipline of one-page truth with auditable depth beneath.
Step Four: Analyse the Movement
Every line’s change gets its explanation: purchases in, consumption out, sales out, losses written off — each flow named and matched to the records that prove it. This step is where the report converts from accounting into management, and no farm stock value report cycle should close without it.
Movements that explain themselves pass; movements that don’t generate findings — and findings are the report’s product, not its by-product.
Step Five: Sign Off and File
The completed report gets one reviewer’s signature and joins its predecessors in the farm’s financial file — the growing series that lenders read, auditors verify, and management compares across seasons. A farm stock value report series is worth more than any single edition, because the series is what reveals trends, seasonality, and the farm’s true inventory rhythm.
Valuing Each Category Honestly
Inputs: FIFO Cost With Expiry Discipline
Inputs value at purchase cost, oldest first — the FIFO method that keeps each price layer honest as seasons move prices. The discipline beneath the valuation is batch-level tracking: receipts recorded with costs and expiry dates, issues recorded against batches, so the farm stock value report input lines carry both their value and their remaining life.
Expiry proximity affects value honestly too: chemicals within weeks of expiry are worth less than their cost suggests, and the report that flags them converts shelf losses into usage urgency while usage is still possible.
Feed: Cost With Turnover Verification
Feed values at cost on the same FIFO logic, with one added check: consumption verification. The godown’s tracked draw-down must reconcile against the herd’s and flock’s actual feeding programme — and the gap between the two is the report’s most regular finding.
Feed also carries shelf-life decay that the valuation should acknowledge: stocks held past their freshness window carry quality risk no unit price captures. The farm stock value report feed lines should therefore pair value with age — because old feed at full value is an optimistic fiction the next silage test will correct.
Livestock: The Largest and Hardest Line
Livestock is usually the report’s biggest number and its hardest valuation, and the honest approach separates classes. Breeding stock values at cost — purchase plus accumulated investment — because their value lies in production, not sale.
Growing stock values by cost-plus-feeding or by weight-class market value, whichever the farm’s policy states. Sale-ready animals value at market. Laying flocks value by production stage — a flock at peak carries different value from the same flock past its curve. A farm stock value report livestock section built this way produces figures lenders and insurers accept, because every class is valued on a stated, defensible basis.
The counting feed for livestock is the production system’s own records: daily events logged, registers always current. Farms whose livestock registers run continuously produce their livestock valuation any morning; farms without them schedule count days and absorb the error rates those days carry.
Produce: By State and by Holding Intent
Produce valuation follows the holding intent, stated plainly. Stock moving to market within days — graded eggs, packed vegetables, cooled milk — values at expected sale price less remaining costs, because that is its honest worth.
Stock held for price appreciation — hermetic-bagged maize stored toward the season’s peak — values at cost plus storage, because its future price is a speculation the report should not pre-book. A farm stock value report produce section split this way tells the truth about both holdings at once.
Tools and Durable Inventory: Cost With Condition
Tools, sprayers, and fittings value at cost less reasonable wear — or simply at cost where condition is good and loss, not depreciation, is the real risk. The line’s total is modest and its discipline is the point: registered items with named custodians are the inventory that stops walking away, and the farm stock value report durable section is where that registration lives.
Reading the Movement Analysis
The movement analysis is the report’s monthly management meeting, and its readings follow a short diagnostic grammar. Stock falling without matching sales or consumption is shrinkage — and shrinkage traced to a category, a store, and a month is a loss catchable while it is still small.
Stock rising without matching purchases is a recording gap — deliveries entering through the wrong door, issues going unrecorded — and the gap is a discipline finding rather than a financial one. Feed falling faster than production justifies is overfeeding, waste, or unrecorded offtake; each has its own correction.
Parked capital is the quieter reading: categories whose value sits unchanged across quarters are money standing still — fertiliser not spread, produce not sold, feed held past its best. Owners who see parked capital in their farm stock value report movements convert it deliberately: use it, sell it, or stop buying it — each conversion releasing cash the farm was effectively lending to its own shelves.
Seasonality is the third reading, and it arrives after a few months of series: the input build before planting, the produce draw-down through harvest, the feed peak through dry seasons. The seasonal curve the farm stock value report series reveals becomes next year’s cash-flow and purchasing plan — the report’s compounding return on top of its loss-catching one.
The Report in Financing, Insurance and the Balance Sheet
The financing channel is the report’s most concrete external value, and it works because lenders price evidence. A loan application supported by a current, counted, policy-stated farm stock value report presents the farm as a quantified set of assets rather than a verbal promise — and credit committees respond to the difference measurably.
The working-capital case is the sharpest: input stock and produce are precisely the assets that seasonal financing exists to bridge, and a report showing their value and turnover is the natural collateral evidence. The farm whose series shows disciplined inventory management borrows on terms the unvalued farm never sees.
Insurance runs the same channel. Fire, flood, and theft claims all require proving what existed and what it was worth — and the farm claiming from a current farm stock value report recovers on evidence, while the farm claiming from memory recovers on sympathy.
The balance-sheet position completes the financial picture: stock value is a current asset, often the farm’s largest after land, and its documented figure is what turns “we have a farm” into “here is what the farm holds, counted last month.” That translation — physical to financial, done monthly — is the report’s deepest contribution to the farm’s standing in every external conversation.
Software Versus Manual Valuation
The manual path — count days, notebooks, and spreadsheets — can produce a report, eventually, with error rates that grow with category count and movement volume. Its structural weakness is the gap between counts: recording deferred, drift accumulating, and each cycle’s count starting further from truth than the last.
The systemised path produces the report continuously: receipts recorded at delivery, issues recorded at use, sales recorded at transaction, livestock events recorded daily — so the farm stock value report becomes a query rather than a project, current to the last entry, with the month’s cycle reduced to verification and review.
Operations that migrated describe the same discovery in the same words: the first system-generated valuation disagreed with every manual estimate the farm had ever made — and the disagreement was the audit the farm had never run. That first honest report is typically where the migration pays for itself, in the losses it surfaces alone.
The integration advantage completes the case: stock movements feeding enterprise costs automatically, inventory feeding procurement alerts, and the report feeding the farm’s financial statements without re-entry. A farm stock value report inside the farm’s management system serves decisions; one built beside it serves filing.
How Often to Run the Cycle
The professional rhythm is monthly for the full workflow — reconcile, value, analyse, sign off — with depth adjusted by risk: full counts for high-value and high-risk categories, verification by exception for stable ones. Daily-production farms with volatile stock — dairies, egg operations — add weekly reviews of their fastest-moving lines.
The quarterly rhythm adds the full physical count across every category, and the annual cycle closes with the complete valuation that feeds year-end accounts and tax documentation. The frequency rule beneath all of it is simple: often enough that losses are caught small and decisions are fed current — because a farm stock value report is a management instrument, and instruments only work while they are live.
Who Needs the Report Most
Commercial crop farms with heavy input holdings need it most urgently, because planting-season stores concentrate enormous capital — and the farms that value monthly catch waste, expiry, and shrinkage that annual valuers absorb silently across whole seasons.
Livestock operations carry the report’s largest and most neglected category: a dairy herd or layer flock is a walking balance sheet, eating daily and changing value continuously. Operations that value their farm stock value report livestock quarterly hold financing and insurance positions the unvalued herd can never present.
Aggregators, traders, and cooperatives holding members’ produce need the report at its highest stakes, because inventory held in trust must reconcile to the kilogram — and the aggregator whose produce valuations reconcile against collections holds the member confidence that volume businesses run on.
Farms seeking credit or investment complete the constituency: the documented valuation series is the balance-sheet evidence that converts applications from stories into assessments, and the farm stock value report series is precisely what asset-based agricultural lending now expects to see.
Common Mistakes That Ruin Valuations
The first mistake is valuing without counting — applying unit values to assumed quantities, which produces a document that looks like accounting and measures nothing. The counted farm stock value report is the only version worth producing, at any scale.
The second is policy drift — valuing produce at sale price one month and cost the next, because optimism moved. The valuation policy is written once and applied identically every cycle, or the series’ comparisons become fiction.
The third is filing without analysing — producing the snapshot and skipping the movement review, which discards the report’s entire management value. A farm stock value report reviewed is worth ten that are filed.
The fourth is the skipped verification — trusting tracked balances indefinitely until shelf and system quietly part ways. Monthly spot-checks and quarterly full counts keep the tracked truth and the physical truth married, and the marriage is what the whole farm stock value report series depends on.
The Future of Inventory Valuation
The direction is automation: stores connected by scanning and scales, livestock registers feeding valuation directly, and reports assembling themselves from continuous records — with the farmer reviewing findings rather than running counts. Farms building disciplined digital stock records today are pre-building that automation, because every valuation system needs clean data before it can calculate anything.
The deeper shift is financial integration: valuations flowing into balance sheets, loan applications, and insurance schedules directly from the records that run the farm. The farm stock value report of the near future is not a document produced for the bank once a year — it is the farm’s live financial position, available to whoever asks, whenever they ask.
Frequently Asked Questions
What is a farm stock value report?
A financial statement converting everything the farm physically holds — inputs, feed, livestock, produce, and durable inventory — into valued, totalled figures, with movement since the last period shown alongside. A proper farm stock value report answers, at any moment, what the farm’s physical assets are worth and how that worth is changing.
How do you value livestock in a stock report?
By a stated policy applied consistently per class: cost basis for breeding and growing stock, market value for sale-ready animals, and production-stage value for laying flocks — chosen once, documented on the report’s face, and never changed with the valuer’s mood. Consistency is what makes farm stock value report livestock figures comparable across months.
How often should a farm produce a stock valuation?
Monthly through the full workflow for most farms — reconcile, value, analyse, sign off — with quarterly full physical counts and weekly reviews for the fastest-moving categories on daily-production farms. The frequency rule for any farm stock value report is simple: often enough that losses are caught small and decisions run on current figures.
Can a stock value report help me get a loan?
Decisively — it is the balance-sheet evidence lenders assess farm credit against, and a current, counted, policy-stated report converts “we have assets” into quantified, verifiable collateral. Farms presenting a maintained farm stock value report series consistently access facilities that estimate-based applications never reach.
What is the difference between stock value and profit?
Stock value is what the farm holds; profit is what the farm earned — and the two connect through consumption, as inputs and feed leave stock and enter costs when used. The farm stock value report opening and closing values are what make profit calculations honest across seasons.
How do I detect theft or loss through stock reports?
Through movement analysis: stock falling without matching sales, consumption, or written-off losses is shrinkage made visible — traceable by category, store, and month. Farms reviewing farm stock value report movements monthly routinely catch leaks in weeks that annual valuers absorb for a year.
How should I value produce I’m holding for better prices?
At cost plus storage rather than expected sale price — because the future price is a speculation the report should not pre-book — while produce moving to market within days values honestly at expected sale value less remaining costs. Stating both bases on the farm stock value report keeps the two holding intents separate and true.
Do I need software to produce the report?
At small scale, disciplined manual records can produce one — with count days, spreadsheets, and accepted error rates. Beyond a handful of categories and any meaningful movement volume, systemised records produce the farm stock value report continuously and reconcile it automatically, which is why most commercial farms migrate once they feel the invisibility gap manual valuation costs them.
What should I do when counted stock doesn’t match records?
Investigate the variance to its cause — recording error, timing gap, unrecorded usage, or genuine loss — correct the records, and document the finding, because every unreconciled gap becomes the norm the next cycle inherits. The reconciled farm stock value report is the only version that compounds in value.
How does the report feed my balance sheet?
Stock value enters as a current asset, often the farm’s largest after land, and its monthly movement explains the gap between profit and cash across the year. The farm stock value report series is what turns the farm’s physical holdings into financial statements anyone can assess.
What categories should the report always include?
Five: inputs and consumables, feed, livestock by class, harvested produce by holding intent, and durable inventory — with every category valued on a stated basis and reconciled against physical reality. A complete farm stock value report covers all five; anything less leaves the farm’s wealth partly unmeasured.
How do I start the monthly workflow on my farm?
Begin with the written valuation policy, then run the first full count as your opening baseline, and from there operate the five-step cycle — reconcile, value, total, analyse, sign off — with verification deepening on your highest-risk categories. The first honest farm stock value report is usually the most surprising document a farm ever produces, and the monthly series it starts is the discipline that keeps every month after it honest.
What is the single biggest benefit of running the report monthly?
Loss detection while losses are still small — a leak caught in month one costs a twelfth of what the same leak costs across an annual cycle, and every other benefit builds on that foundation. This is why the monthly farm stock value report is the highest-return financial habit a stock-holding farm can install.
How long does the monthly cycle take once the system runs?
An hour or two for a well-recorded farm — verification, valuation, and movement review — because the continuous records do the counting in advance. The farm stock value report that takes days is the one being built from fog; the one that takes an hour is the one built from discipline.